The background
The client for this project was the #1 event app platform worldwide reaching thousands of event planners and millions of attendees in over 40 countries. Supporting a variety of organizations from the Fortune 500 to professional associations, their goal is to carefully blend the user experience with the event experience, and change the way attendees engage at live events.
Through client feedback, we discovered that survey reporting was causing us to lose significant business to competing brands. Our current version of the feature at the time offered survey reporting, but clients were not using it as it wasn’t meeting their needs. If clients aren't able to get valuable feedback from their event attendees that aligns with stakeholder objectives for the event, it becomes more challenging to validate the value of the event, as well as the event app. For this reason, we chose to explore how we could solve this problem so we could improve retention of our client-base.
At this time, we were transitioning from our old CMS to our new framework.
The project objectives
- update the survey analytics tool in new platform framework
- understand the landscape of survey reporting
- figure out what needs weren’t being met by the current experience
- explore different solutions of ways to better meet client needs that fits into our current framework
My contributions
- User research
- Competitor research
- Feature development
- iA (current and proposed)
- Wireframe andhi-fidelity prototypes
Pain points from user research
- clients wanted to see results for the purposes of testing, throughout the event while the survey is live as well as after the events was over
- clients wanted an easy way to present analytics from survey to provide a high-level overview for stakeholders
- exported reports were not present the information they needed
- clients delayed creation of surveys because they weren't sure how to use them or the types of questions they should ask
Original workflow
jobs to be done
Provide clients with the ability to easily and conveniently create and edit survey questions, and review results as they come in so that they can better manage and measure the success of their event.
Old vs. new proposed iA
A crucial aspect of the transition into the new framework, it was necessary to understand the iA of the old, learn what worked and didn't work, and propose a new structure based on the findings. Here are two snippets of the work that was done around iA remodelling.
The solution
Wireframe exploration
After working with the product team to go through the research findings, and narrowing down the iA structure we wanted, I starting exploring through wireframed prototyping. Here I went through several iterations and usability tests to come to the most optimal workflow.
Exporting survey reports
Question creation and review
In the new platform, we wanted to go one step further and allow users to view their data as it updates live, as well as allow them to toggle between building their survey and reviewing the results.
The high-fidelity prototype
After numerous iterations and tests with the wireframed prototype, I moved into high-fidelity mocks for further review and testing.
Event survey list
Quick access to high-level info: top-of-mind information displayed in the forefront
Survey Status: distinction between active, inactive, and hidden surveys
Live Survey Accessibility: link to live survey
question creation
This page addresses use case of survey creation before the survey is active, where the user's main purpose is to create and set up their questions
Add, Edit & Reorder: priority functionality is adding, editing and reordering questions
reviewing the results
This page addresses the use case of survey results being reviewed after the survey is active, or post-survey completion.
Survey Dashboard: It features a dashboard showing high-level stats on success of the survey, including an 'tips' section that suggest best practices to increase response rate.
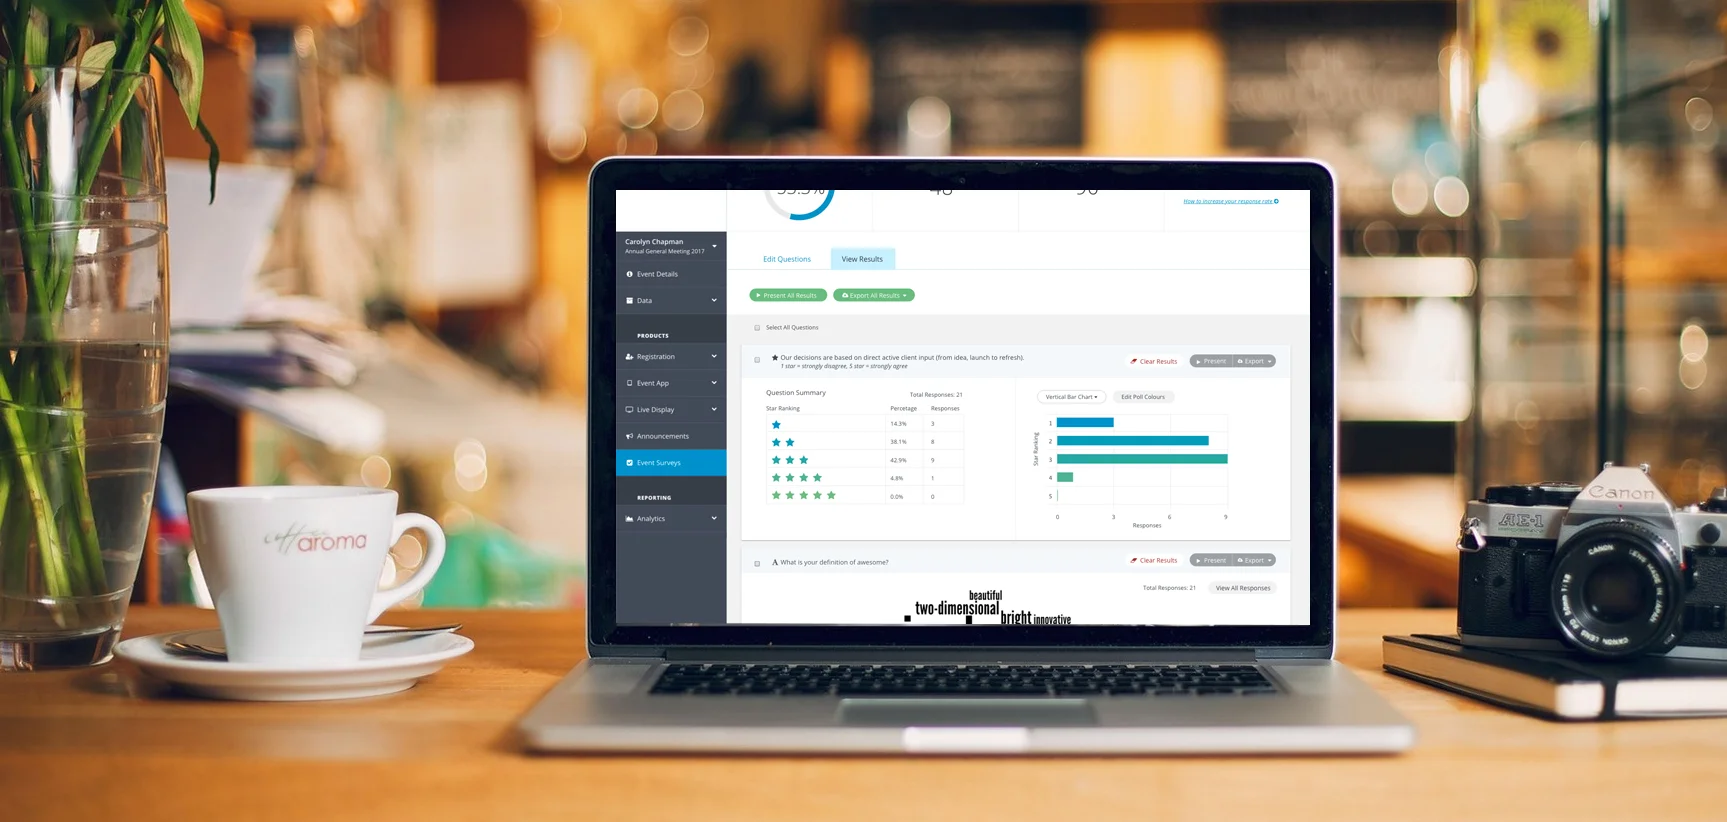
Visualized Live Results: Here, the user has the option to view more detailed visualizations of the results per question, with additional functionalities to share them.
Toggle Between Creation and Review: However, if the user enters this page and has the intention to create and/or edit their questions, they can hide the data which will collapse each card (previous mock).
free form responses
A challenge faced by the team was how visualize the free form responses and how to make them more actionable
Search & Filter: ability to search and filter responses by key words to see trends
Sharing key insights: ability export or present specific responses
The outcome
The project was a success receiving great feedback from clients who transitioned from the original to the updated content manager. The result was improved reporting for clients, and improved retention of our client base.


